Trend: Attempting recovery after a major pullback.
🔑 Key Observations:
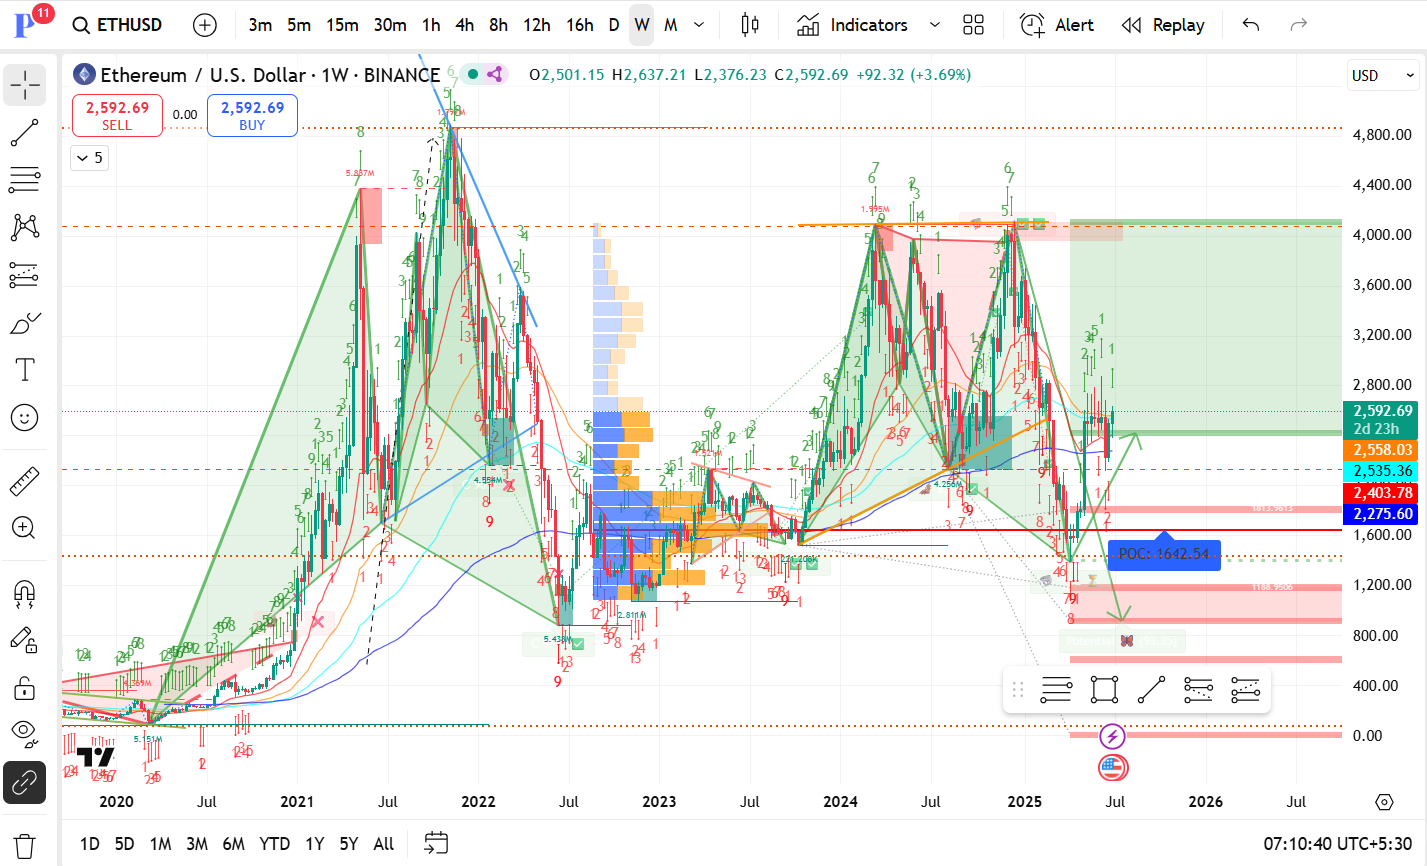
Major Resistance Levels:
$2,800 – $3,200: Strong supply zone with multiple past rejections.
Significant congestion below $4,000, which capped previous bull runs.
Immediate Support Levels:
$2,558 (first level support—near-term stability).
$2,535
$2,403
Stronger support sits at:
$2,275 (volume cluster + structural).
POC: $1,642—This is the historical Point of Control where most trading activity has occurred.
Bearish Risk Levels (Downside Targets):
If the current bounce fails, price could revisit:
$1,600
$1,200
Extreme bear case: sub-$1,000 zone (unlikely unless a market-wide crash).
Chart Patterns:
Multiple M-shaped double tops and W-shaped double bottoms suggest a volatile but well-respected pattern structure.
Current recovery is from a higher low compared to previous major lows (positive for bulls).
TD Sequential & Elliott Wave:
Several TD 9s and 13s are visible, signaling potential exhaustion in both directions.
The current upward move looks like it could be Wave 3 or Wave 5, but still within a broader corrective context.
Fibonacci Levels:
Fib retracements show key levels aligned with historical price congestion zones.
The risk of a move back towards 61.8% retracement (near $1,200–$1,600) is still present unless bulls reclaim higher levels.
Volume Profile:
Heavy accumulation noted between $1,500 – $2,200.
Above $2,600, there’s less volume resistance, allowing faster upward movement if broken.
Moving Averages:
Price is currently:
Slightly above or testing the 50-week MA.
Below the 100-week MA and well below 200-week MA.
These MAs could act as dynamic resistance unless convincingly broken.
📈 Scenarios Ahead:
Scenario
Price Targets
Trigger/Conditions
Bullish Breakout
$2,800 → $3,200 → $3,600+
Strong weekly close above $2,650–$2,800 with volume
Sideways Accumulation
$2,275 → $2,800 range
Price consolidates between key support and resistance
Bearish Breakdown
$2,200 → $1,642 → $1,200
Weekly close below $2,275 triggers deeper correction
📌 Summary Takeaways:
✅ Bulls need to reclaim $2,800–$3,000 to signal a stronger uptrend continuation. ✅ Losing $2,275–$2,400 could open up risk towards $1,600–$1,200. ✅ Macro-level resistance near ATH zones (~$4,000) is still far off but will be the next big challenge.


 by Shahnawaz Alam