Office Address
Pune India
Phone Number
8208696981
Email Address
info@pivopen.com
Pune India
8208696981
info@pivopen.com


 by Shahnawaz Alam
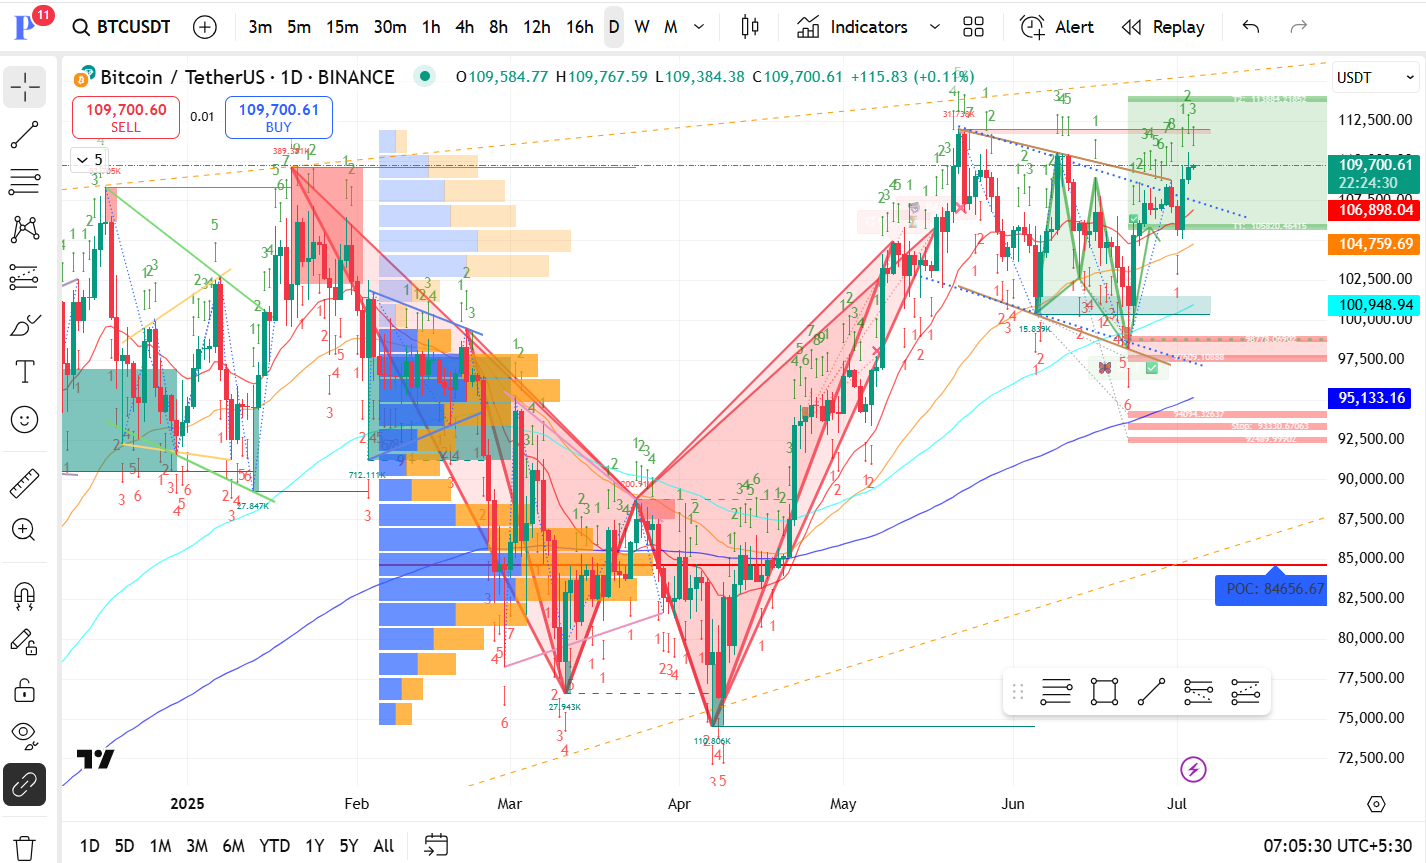
| Scenario | Target Levels | Triggers/Notes |
|---|---|---|
| Bullish Breakout (Primary Bias) | $112,500 → $115,000+ | Close above $110K with volume → new highs possible |
| Range-bound Consolidation | $106,893 → $110,000 | Possible short-term chop as price builds energy |
| Bearish Pullback | $104,757 → $100,948 | Break below $106K triggers a retest of lower supports |
| Deep Correction | $95,132 → $84,656 | Only if macro sentiment turns negative |
👉 My Take: