Office Address
Pune India
Phone Number
8208696981
Email Address
info@pivopen.com
Pune India
8208696981
info@pivopen.com


 by Shahnawaz Alam
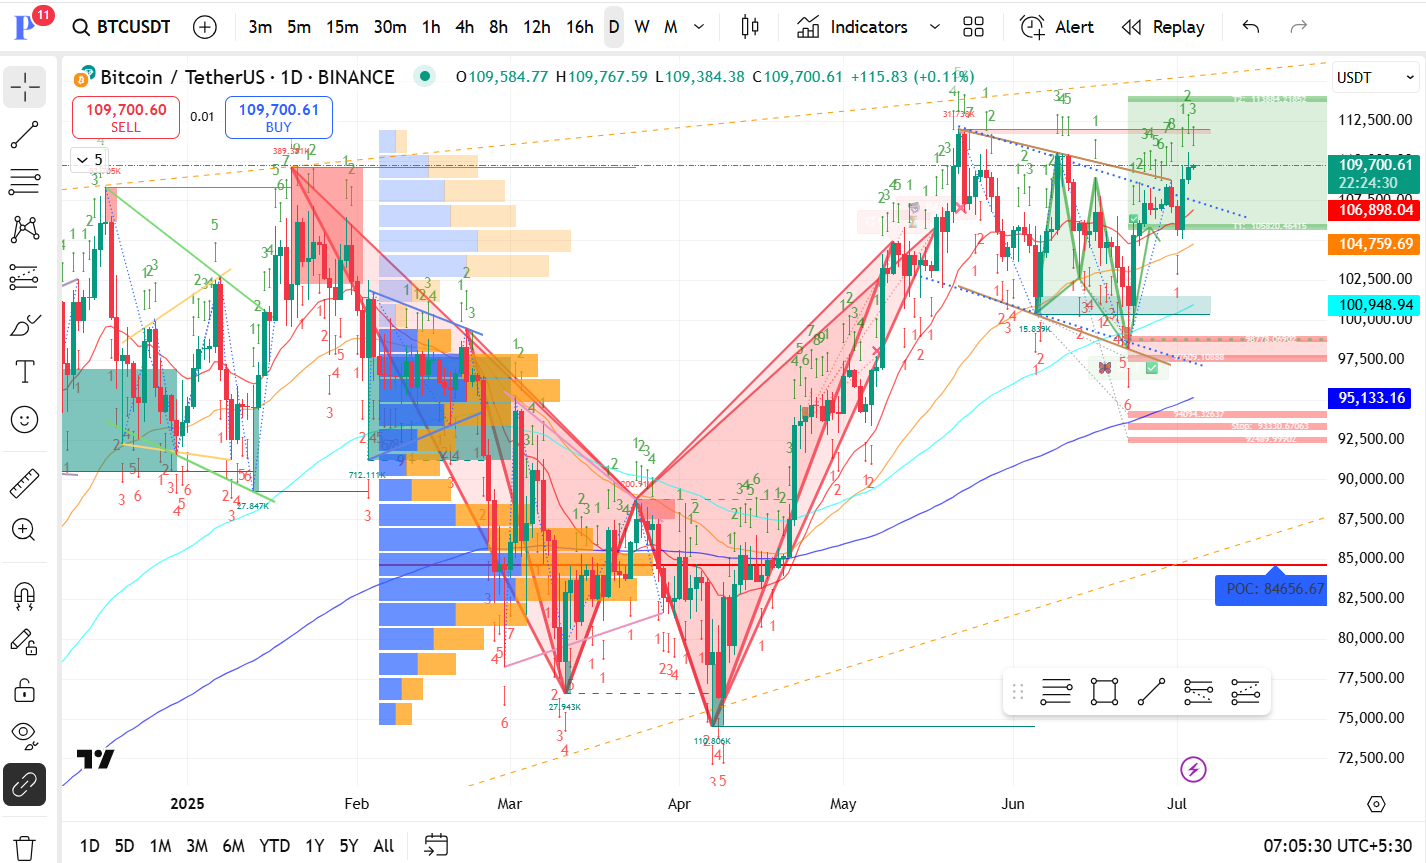
Current Price: $109,656 (as of this daily candle)
Short-Term Trend: Bullish breakout attempt from a descending triangle or wedge pattern.
Volume Profile (POC): High interest/support zone near $84,656.
Chart Patterns:
Multiple W-shaped double bottom patterns (highlighted in red) are visible, especially the strong bounce in March–April.
Recent breakout from a descending trendline with a sharp bullish move.
Bullish flag or pennant formation that’s potentially resolving upward.
Support & Resistance:
Immediate Resistance: ~$110,000 – $112,500 zone (previous highs).
Immediate Support: ~$106,893 (recent breakout area).
Next key supports:
$104,757 (strong candle base and minor demand zone).
$100,948 (psychological and structural support).
$95,132 (marked key support + 200 MA convergence).
Volume Profile Insights:
Strong historical volume concentration (blue bars) between $95,000–$100,000.
Thin liquidity above $110,000—this could lead to sharp moves in either direction.
The major POC at $84,656 remains the ultimate strong base (but far below current price).
Moving Averages:
Price is above:
50-day MA
100-day MA
200-day MA (around $95K).
The bullish alignment of moving averages confirms a strong medium-term trend.
TD Sequential & Elliott Waves:
The chart shows advanced TD counts (1–9), which can indicate trend exhaustion or continuation depending on price reaction.
The recent green counts suggest a fresh bullish leg is underway after correction.
Fibonacci Retracement:
There is a small visible Fib retracement suggesting price has cleared the 61.8% level of the previous swing down, indicating strength.
| Scenario | Target Levels | Triggers/Notes |
|---|---|---|
| Bullish Breakout (Primary Bias) | $112,500 → $115,000+ | Close above $110K with volume → new highs possible |
| Range-bound Consolidation | $106,893 → $110,000 | Possible short-term chop as price builds energy |
| Bearish Pullback | $104,757 → $100,948 | Break below $106K triggers a retest of lower supports |
| Deep Correction | $95,132 → $84,656 | Only if macro sentiment turns negative |
👉 My Take:
The chart looks bullish but approaching critical resistance.
Immediate watch zone: $110K+ breakout or $106K retest.
Keep an eye on volume spikes—low volume could mean false breakouts.