Office Address
Pune India
Phone Number
8208696981
Email Address
info@pivopen.com
Pune India
8208696981
info@pivopen.com


 by Shahnawaz Alam
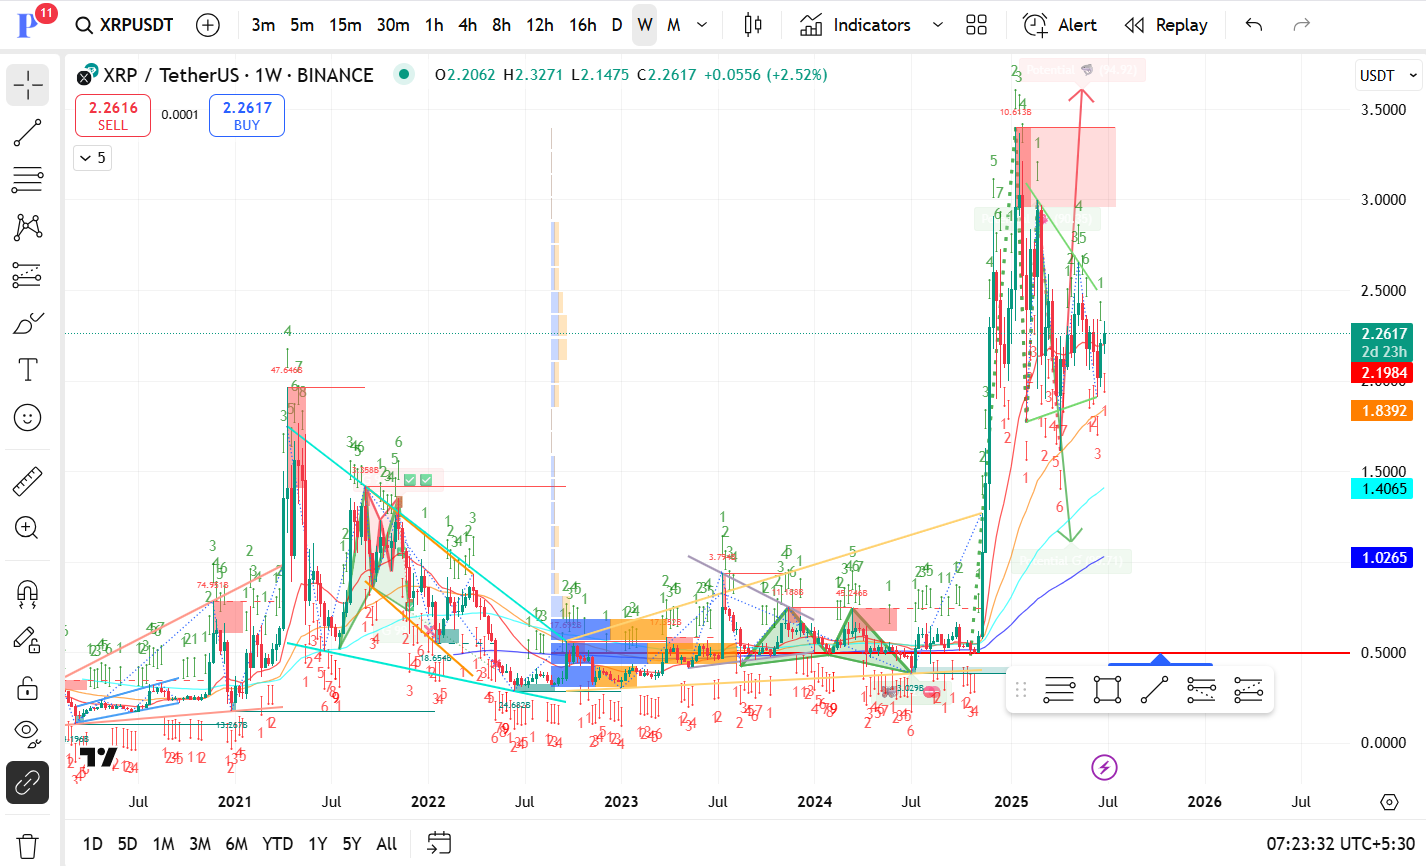
Current Price: $2.26
Recent Action: Strong breakout from long-term accumulation, currently in consolidation after an aggressive move up.
$2.50 – $3.00: This is the significant overhead resistance zone where the previous rally was capped.
A potential upside target near $3.50+ is highlighted with an upward red arrow on your chart—this aligns with historical highs.
$2.19 (first immediate support—key for short-term stability).
$1.83 (secondary support).
$1.40 (critical support near the 100-week MA).
$1.02 (last major line of defense).
POC near $0.50 (long-term base).
Strong historical volume concentration (blue/orange blocks) below $1.00–$1.50.
Above $2.50, thin liquidity could accelerate a sharp move higher if price clears resistance.
Multiple TD Sequential counts (both red and green) suggest the asset is in a corrective wave phase after a parabolic move up.
Possible Wave 3 completion with a correction in progress, looking for potential Wave 5 higher.
Price remains above all key MAs (50, 100, 200-week)—a strong bullish signal.
The blue MA (likely 200WMA) at $1.02 offers long-term support.
| Scenario | Target | Probability |
|---|---|---|
| Bullish Continuation: Break and close above $2.50 → $3.50 | 50% | |
| Healthy Correction: Retest $1.83 → $1.40 | 35% | |
| Severe Pullback: Below $1.02 → revisit POC near $0.50 | 15% (less likely unless macro crash) |
✅ Trend is bullish with higher highs and higher lows forming.
✅ Breakout from long-term sideways suggests institutional interest.
✅ Potential upside to $3.50 but short-term correction risk remains unless $2.50 is broken with volume.