Office Address
Pune India
Phone Number
8208696981
Email Address
info@pivopen.com
Pune India
8208696981
info@pivopen.com


 by Shahnawaz Alam
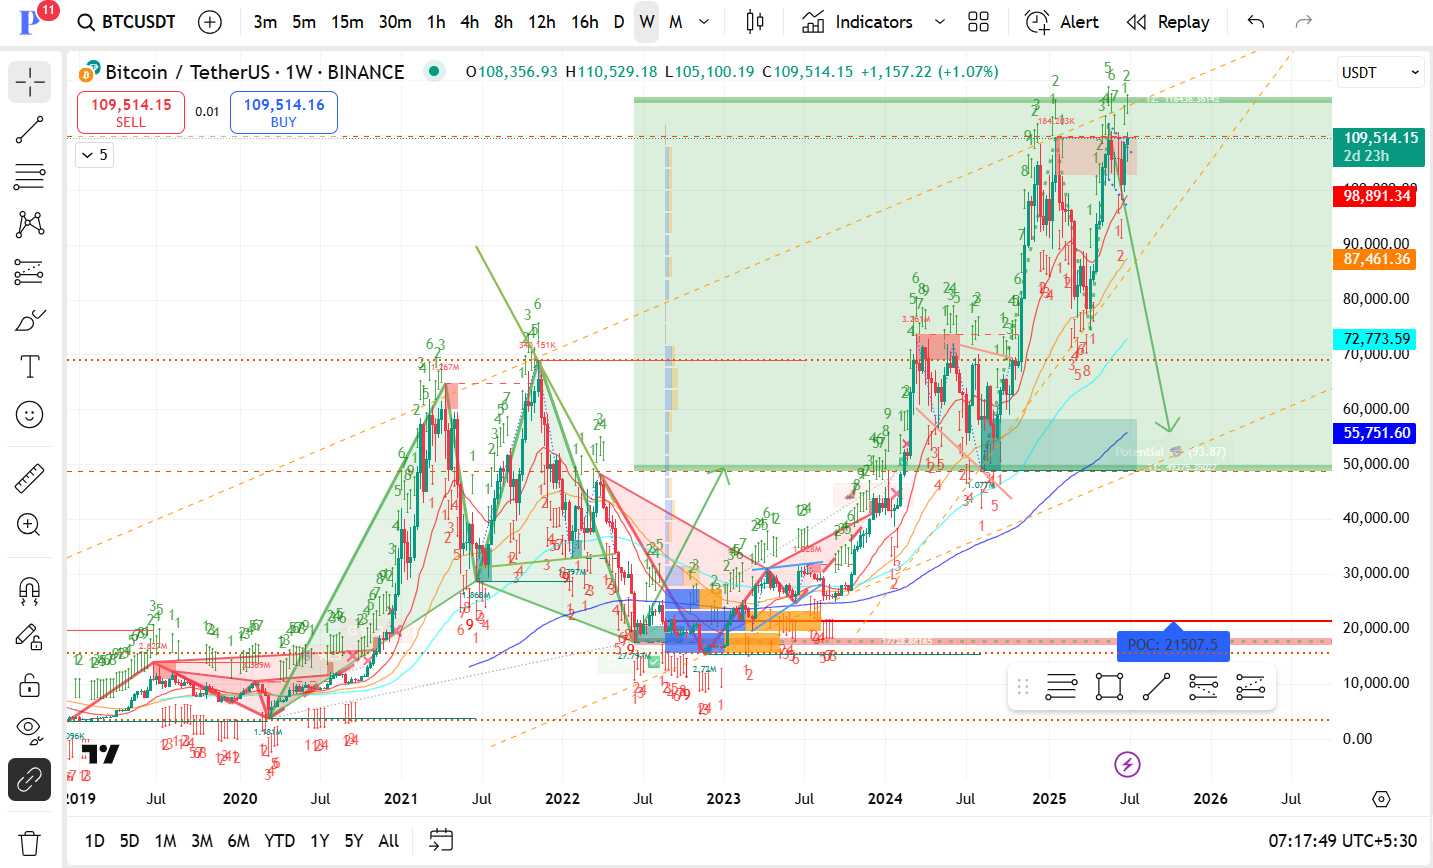
Price: $109,514
Weekly Candle: Still inside the high resistance zone with upward momentum but signs of hesitation.
Primary Resistance: $109,000 – $115,000 (current test zone)
This area has historical rejection (previous top) and is showing some wick rejections.
First Key Support: $98,891 (red dotted line) — must hold to avoid deeper pullback.
Next:
$87,461
$72,773 — structural and Fib zone.
$55,751 — near 200-week MA (very strong support historically).
$21,507.5 — This is the high-volume traded price from the 2022–2023 accumulation zone.
Only relevant in extreme bear cases.
The TD green 9s suggest potential exhaustion.
You’re also showing Elliott-type wave structures—price may be finishing an impulsive 5-wave sequence (risk of correction next).
Thin volume zones above $110K could lead to quick upside if resistance breaks.
High volume clusters are visible between $20K–$40K and $60K–$80K—potential magnets if macro shifts.
Price remains within an upward sloping megaphone/wedge.
Diagonal supports are intact but showing vulnerability on sharper corrections.
| Scenario | Levels | Likelihood (Est.) |
|---|---|---|
| Bullish Continuation: | $115K → $125K (ATH challenge) | 40% |
| Healthy Correction (Base Building): | $98K → $87K → $72K | 45% |
| Severe Correction (Macro risk/off): | $55K → $21K (unlikely unless systemic) | 15% |
The green arrow down on your chart suggests awareness of a potential large-scale ABC correction after this run-up.
The long-term moving averages are still supportive but price is getting over-extended on weekly charts.
Macro events (Fed, ETF flows, global risk appetite) will likely influence which path BTC follows next.
👉 Key Levels to Watch This Month:
Hold Above: $98K to maintain bullish structure.
Break Above: $115K to target new highs.
Break Below: $87K opens door for retest of $72K.